Facebook is still one of the biggest social media platforms in the world, with billions of active users engaging every day. Today, the iMyFone Fixppo team will dive into extensive research to present the most up-to-date Facebook statistics for 2025.
We'll cover key details like user statistics, demographics and engagement rate. Whether you're a marketer tracking its growth or a business owner looking for useful strategies, these insights will keep you updated. Let’s get started!
In this article:
An Overview of Facebook
1 What is Facebook?
Facebook is a social media platform that allows you to connect with friends, family, and communities online. You can create personal profiles, share updates, photos, and videos or check posts and stories from people you follow.
2 When did Facebook come out?
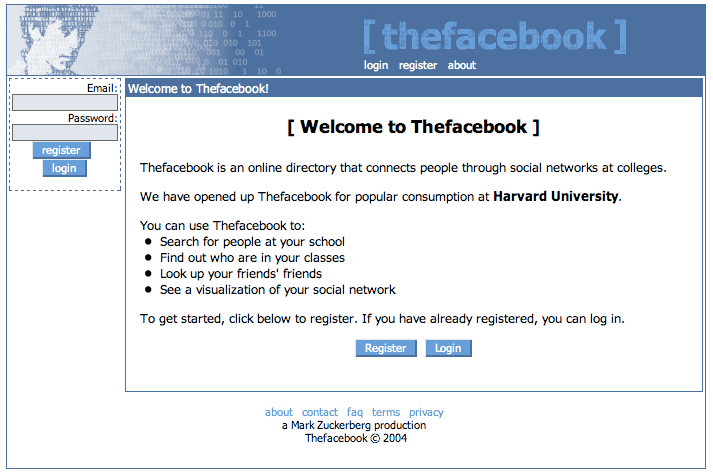
Facebook was launched on February 4, 2004. It was initially created as a social networking site for students. It later expanded to the public and became one of the world's largest social media platforms.
3 Who founded Facebook?
Facebook was founded by Mark Zuckerberg along with his college roommates Eduardo Saverin, Andrew McCollum, Dustin Moskovitz, and Chris Hughes. They were all students at Harvard University when they created this application.
Among them, Mark Zuckerberg is considered the primary founder and the driving force behind Facebook. The remainder are responsible for providing funding, assisting with coding, development, design, and publicity, among other things.
4 When did Facebook become popular?
Facebook became popular shortly after its launch in 2004, but the introduction of news push, Facebook ads, and third-party apps between 2006-2008 made it the dominant social network.
5 Is Facebook still popular?
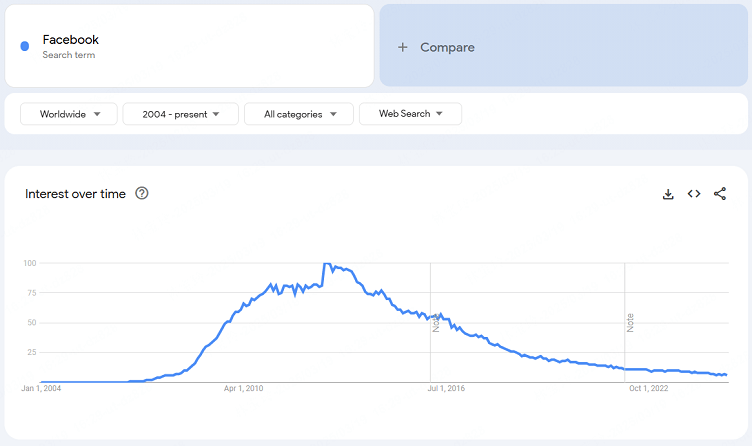
Yes, Facebook is still popular. It's the third most-visited website behind Google and YouTube as of 2025, with 3.06 billion active users every month, which explains its popularity.
Despite its diminished popularity, it is still relatively stable in the marketplace.
Source: Google Trends
Facebook User Statistics
1 Facebook Monthly Active Users
Facebook's Monthly Active Users (MAUs) have maintained steady growth over the years, reaching 3.07 billion as of 2024. This represents a 3% increase from the 2.96 billion MAUs in 2022.

It's worth noticing that Facebook reached the 3 billion MAU milestone in early 2023, reinforcing its status as one of the most widely used social platforms.
| Year & Quarter | MAUs by Quarter |
|---|---|
| Q4 2023 | 3065 million |
| Q3 2023 | 3049 million |
| Q2 2023 | 3030 million |
| Q1 2023 | 2989 million |
| Q4 2022 | 2963 million |
| Q3 2022 | 2958 million |
| Q2 2022 | 2934 million |
| Q1 2022 | 2936 million |
| Q4 2021 | 2912 million |
| Q3 2021 | 2910 million |
| Q2 2021 | 2895 million |
| Q1 2021 | 2853 million |
| Q4 2020 | 2797 million |
| Q3 2020 | 2740 million |
| Q2 2020 | 2701 million |
| Q1 2020 | 2603 million |
| Q4 2019 | 2498 million |
| Q3 2019 | 2449 million |
| Q2 2019 | 2414 million |
| Q1 2019 | 2375 million |
| Q4 2018 | 2320 million |
| Q3 2018 | 2271 million |
| Q2 2018 | 2234 million |
| Q1 2018 | 2196 million |
| Q4 2017 | 2129 million |
| Q3 2017 | 2072 million |
| Q2 2017 | 2006 million |
| Q1 2017 | 1936 million |
| Q4 2016 | 1860 million |
| Q3 2016 | 1788 million |
| Q2 2016 | 1712 million |
| Q1 2016 | 1654 million |
| Q4 2015 | 1591 million |
| Q3 2015 | 1545 million |
| Q2 2015 | 1490 million |
| Q1 2015 | 1441 million |
| Q4 2014 | 1393 million |
| Q3 2014 | 1350 million |
| Q2 2014 | 1317 million |
| Q1 2014 | 1276 million |
| Q4 2013 | 1228 million |
| Q3 2013 | 1189 million |
| Q2 2013 | 1155 million |
| Q1 2013 | 1110 million |
| Q4 2012 | 1056 million |
| Q3 2012 | 1007 million |
| Q2 2012 | 955 million |
| Q1 2012 | 901 million |
| Q4 2011 | 845 million |
| Q3 2011 | 800 million |
Source: Statista
2 Facebook Daily Active Users

Facebook currently has an average of 2.11 billion daily active users (DAUs). The report shows a 5.5% year-over-year increase in daily active users, which means that 39.07% of the world's active Internet users visit Facebook every day.
| Year & Quarter | DAUs by Quarter |
|---|---|
| Q4 2023 | 2,110 million |
| Q3 2023 | 2,085 million |
| Q2 2023 | 2,064 million |
| Q1 2023 | 2,037 million |
| Q4 2022 | 2,000 million |
| Q3 2022 | 1,984 million |
| Q2 2022 | 1,968 million |
| Q1 2022 | 1,960 million |
| Q4 2021 | 1,929 million |
| Q3 2021 | 1,930 million |
| Q2 2021 | 1,908 million |
| Q1 2021 | 1,878 million |
| Q4 2020 | 1,845 million |
| Q3 2020 | 1,820 million |
| Q2 2020 | 1,785 million |
| Q1 2020 | 1.734 million |
| Q4 2019 | 1,657 million |
| Q3 2019 | 1,623 million |
| Q2 2019 | 1,587 million |
| Q1 2019 | 1,562 million |
| Q4 2018 | 1,523 million |
| Q3 2018 | 1,495 million |
| Q2 2018 | 1,471 million |
| Q1 2018 | 1,449 million |
| Q4 2017 | 1,401 million |
| Q3 2017 | 1,368 million |
| Q2 2017 | 1,325 million |
| Q1 2017 | 1,284 million |
| Q4 2016 | 1,227 million |
| Q3 2016 | 1,179 million |
| Q2 2016 | 1,128 million |
| Q1 2016 | 1,090 million |
| Q4 2015 | 1,038 million |
| Q3 2015 | 1,007 million |
| Q2 2015 | 968 million |
| Q1 2015 | 936 million |
| Q4 2014 | 890 million |
| Q3 2014 | 864 million |
| Q2 2014 | 829 million |
| Q1 2014 | 802 million |
| Q4 2013 | 757 million |
| Q3 2013 | 728 million |
| Q2 2013 | 699 million |
| Q1 2013 | 665 million |
| Q4 2012 | 618 million |
| Q3 2012 | 584 million |
| Q2 2012 | 552 million |
| Q1 2012 | 526 million |
| Q4 2011 | 483 million |
| Q3 2011 | 457 million |
Source: Statista
3 Facebook User Growth Rate History
Looking at this growth curve, it appears that Facebook's growth in new users is slowing down, but this growth trend seems to be expected considering the fact that it has been growing for years.
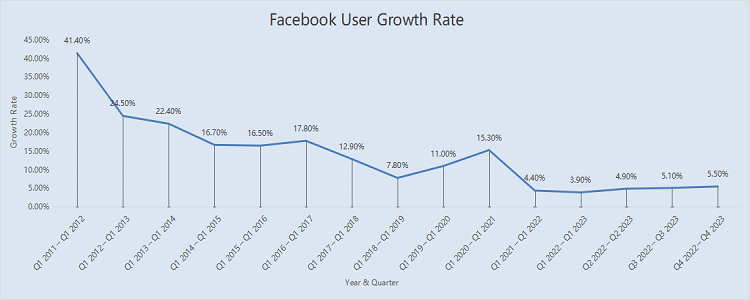
Combined with its other services like WhatsApp, Messenger and Instagram, Facebook's user growth is still on a positive trend.
| Period | Facebook User Growth Rate |
|---|---|
| Q1 2011 – Q1 2012 | 41.4% |
| Q1 2012 – Q1 2013 | 24.5% |
| Q1 2013 – Q1 2014 | 22.4% |
| Q1 2014 – Q1 2015 | 16.7% |
| Q1 2015 – Q1 2016 | 16.5% |
| Q1 2016 – Q1 2017 | 17.8% |
| Q1 2017 – Q1 2018 | 12.9% |
| Q1 2018 – Q1 2019 | 7.8% |
| Q1 2019 – Q1 2020 | 11.0% |
| Q1 2020 – Q1 2021 | 15.3% |
| Q1 2021 – Q1 2022 | 4.4% |
| Q1 2022 – Q1 2023 | 3.9% |
| Q2 2022 – Q2 2023 | 4.9% |
| Q3 2022 – Q3 2023 | 5.1% |
| Q4 2022 – Q4 2023 | 5.5% |
Facebook Demographics and Audience
1 Facebook Users by Gender
Statistically, Facebook has 56.7% male users and 43.3% female users. Both genders are active on the platform, but overall, Facebook's user base is leans slightly more toward male users.
Below is the table of Facebook gender demographics:
| Gender of Facebook Users | Gender Ratio |
|---|---|
| Female | 43.3% |
| Male | 56.7% |
2 Facebook Users by Age
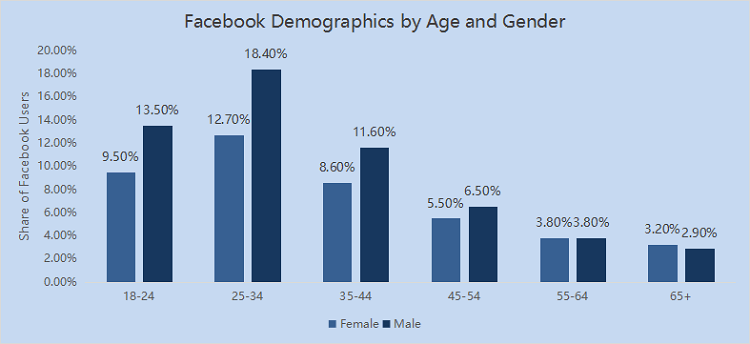
Like most social platforms, Facebook's user base is concentrated among young people, with the largest number of users in the 25-34 age group, followed by those in the 18-24 age group. Meanwhile, in line with the overall male-to-female ratio, both age groups have a slightly higher percentage of male users than female users.
Engagement among users over 45 declined by roughly 10%, and users over 65 had the smallest share, all of which show Facebook's strong appeal among young people, making it the best choice for hundreds of millions of people.
Below is the table of Facebook age demographics:
Source: Statista
3 Facebook Users by Country
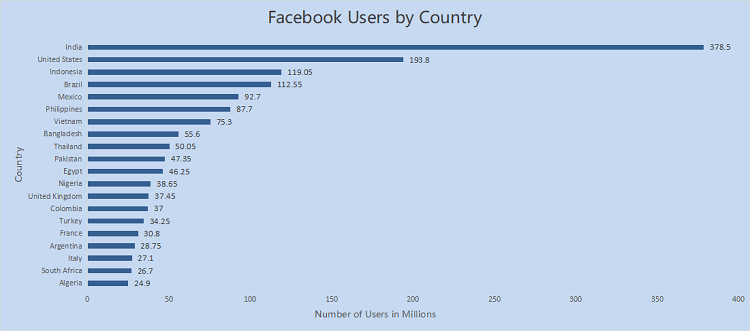
When Facebook's user base is broken down by country, it can be seen that India leads the rest of the world as Facebook's largest market, with 375 million users. It is closely followed by the United States with around 194 million users.
Indonesia (117.6 million), Brazil (110.9 million), and Mexico (91.5 million) ranked in that order, demonstrating Facebook's strong presence in different parts of the world as well as its amazing user base.
Below is the table of Facebook usage by country:
Source: Doofinder
4 Facebook Audience Insights
Statistically, 90% of social media consumers have a Facebook profile, with Generation X using Facebook the most, followed by Baby Boomers and Millennials.
Facebook Engagement Statistics
1 Average Time Spent on Facebook
According to eMarketer's study of Americans over the age of 18, they will spend an average of 30.9 minutes per day on Facebook in 2023, two minutes less compared to 33 minutes in the previous two years.
Compared to other social platforms, TikTok (53.8 minutes), X (34.1 minutes), and Instagram (33.1 minutes), Americans over the age of 18 are spending less average time browsing on Facebook but in favor of exploding platforms like TikTok.
Notably, users between the ages of 55 and 64 spend the most time on Facebook - 45 minutes a day, which may have something to do with their preferences for news articles, discussion threads, and long posts on Facebook.
2 What Are the Facebook Peak Times?
Research data shows that the peak time of Facebook is between 9am and 3pm on weekdays. Wednesday is the best time to post around 11 a.m. and 1 p.m., when your posts get the most interaction.
Conversely, posts before 5am and after 9pm has the lowest engagement, and Saturday and Sunday are the worst times to post on Facebook.
Source: SocialPilot
3 Facebook Engagement Rate
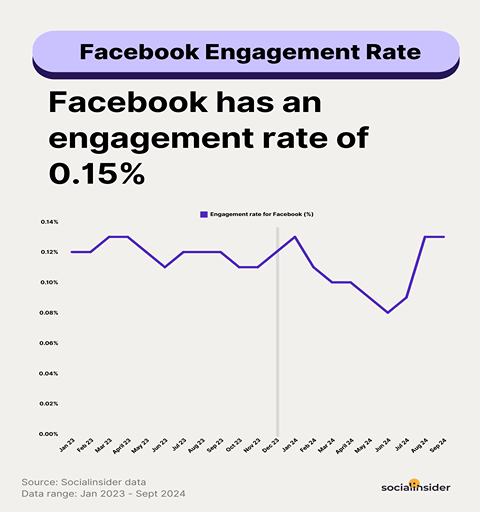
Engagement rate reflects the extent to which users interact with a post in the form of likes, comments, shares, etc.
A study by SocialInsider says that as of 2025, along with X, Facebook's engagement rate is 0.15%, far behind social platforms like tiktok, Instagram, and others.
4 Most Engaging Post Type on Facebook
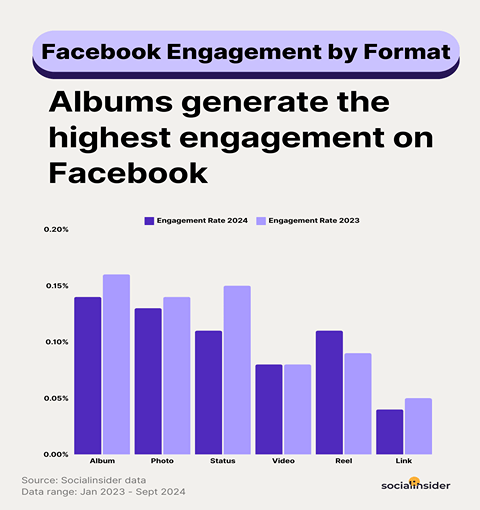
Albums are the best performing post type on Facebook as far as engagement is concerned. This is because it engages more people, increases interaction, and tells a better story. This increases the amount of time users spend on the post, which in turn increases the interaction of the post and improves the overall engagement.
Source: Socialinsider
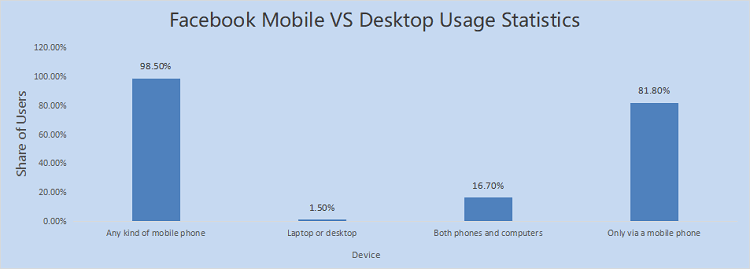
Facebook Mobile VS Desktop Usage Statistics
Divided by device type, more than 98% of users globally can access Facebook via mobile devices, with 81.8% of users accessing Facebook using only their cell phones, far outpacing desktop-only users, which accounted for only 1.5% of users.
Conclusion
Hopefully, this Facebook statistics guide written by the iMyFone Fixppo team will provide some reference for those interested in the Facebook landscape in 2025.
-
[2025 Full Guide] All About iOS Update Issues and Solutions
Have you encountered different problems during or after iOS update? This article focuses on all iOS update issues and solutions. Hope you can learn from it.
5 mins read -
[Full Guide] 50+ iOS 18 Bugs and Fixes You Should Know 2025
What are some known iOS 18 bugs? Read on this article to learn everything about iOS 18 bugs and fixes.
5 mins read -
iPhone Not Receiving Texts? 12 Ways to Get Messages Again!
Your iPhone not receiving texts? Read on this article with 12 methods that cover all aspects to let you get the text messages smoothly again!
4 mins read -
Unveil 5 Free Methods to Fix iPhone Stuck in Recovery Mode
Is your iPhone stuck in recovery mode? This article will unveil 5 free ways for you to exit iPhone recovery mode. Choose the one that suits your need!
3 mins read -
How to Fix iOS 18 Not Showing Up in 5 Ways? [Video Guide]
Ready to enjoy the iOS 18 new features but the iOS 18 not showing up on iPhone? You can learn how to fix iOS 18 update not appearing with 5 solutions here.
3 mins read -
9 Ways to Fix iPhone Won't Turn Off [5 Minutes Done]
iPhone won't turn off when there are problems with it? Learn how to fix iPhone can't power off with 9 ways, these also work when your buttons are broken.
4 mins read


Was this page helpful?
Thanks for your rating
Rated successfully!
You have already rated this article, please do not repeat scoring!